Usage Examples
hdf5 file
Calling the code as:
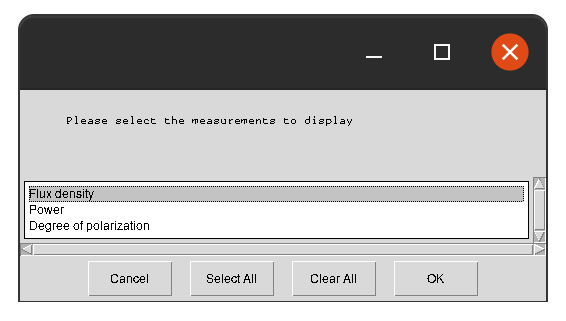
space_label.py cassini_data.hdf5 2006-02-10 2006-02-11 -g 600
Will load the file cassini_data.hdf5, and prompt the user to select which measurements to display:
Once selected, the radio observations will be displayed for the time window 10/2/2006 to 11/2/2006:
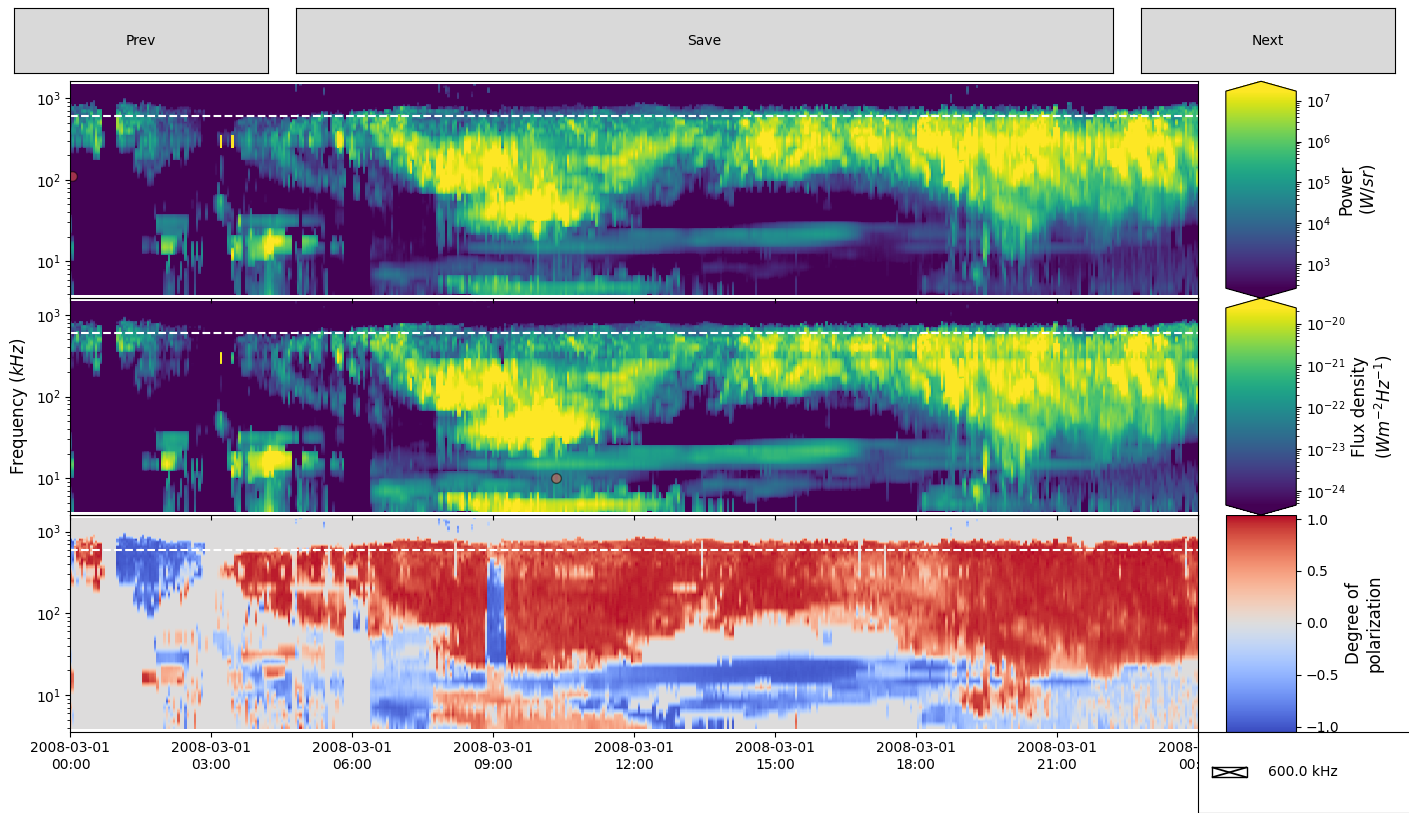
The user can then draw polygon in one panel. The Figure below show Intensity (top panel) and Polarization (bottom panel) data. At the top right of the top panel one can see a polygon that has just been drawn and closed, with the window for naming the feature appearing at the top left of the graphics window. Features can be selected on any pane, and will be mirrored on all other panes once named. Other features have already been labelled, and appear in both intensity and polarisation views, with their names overlaid.

cdf file
Calling the code as:
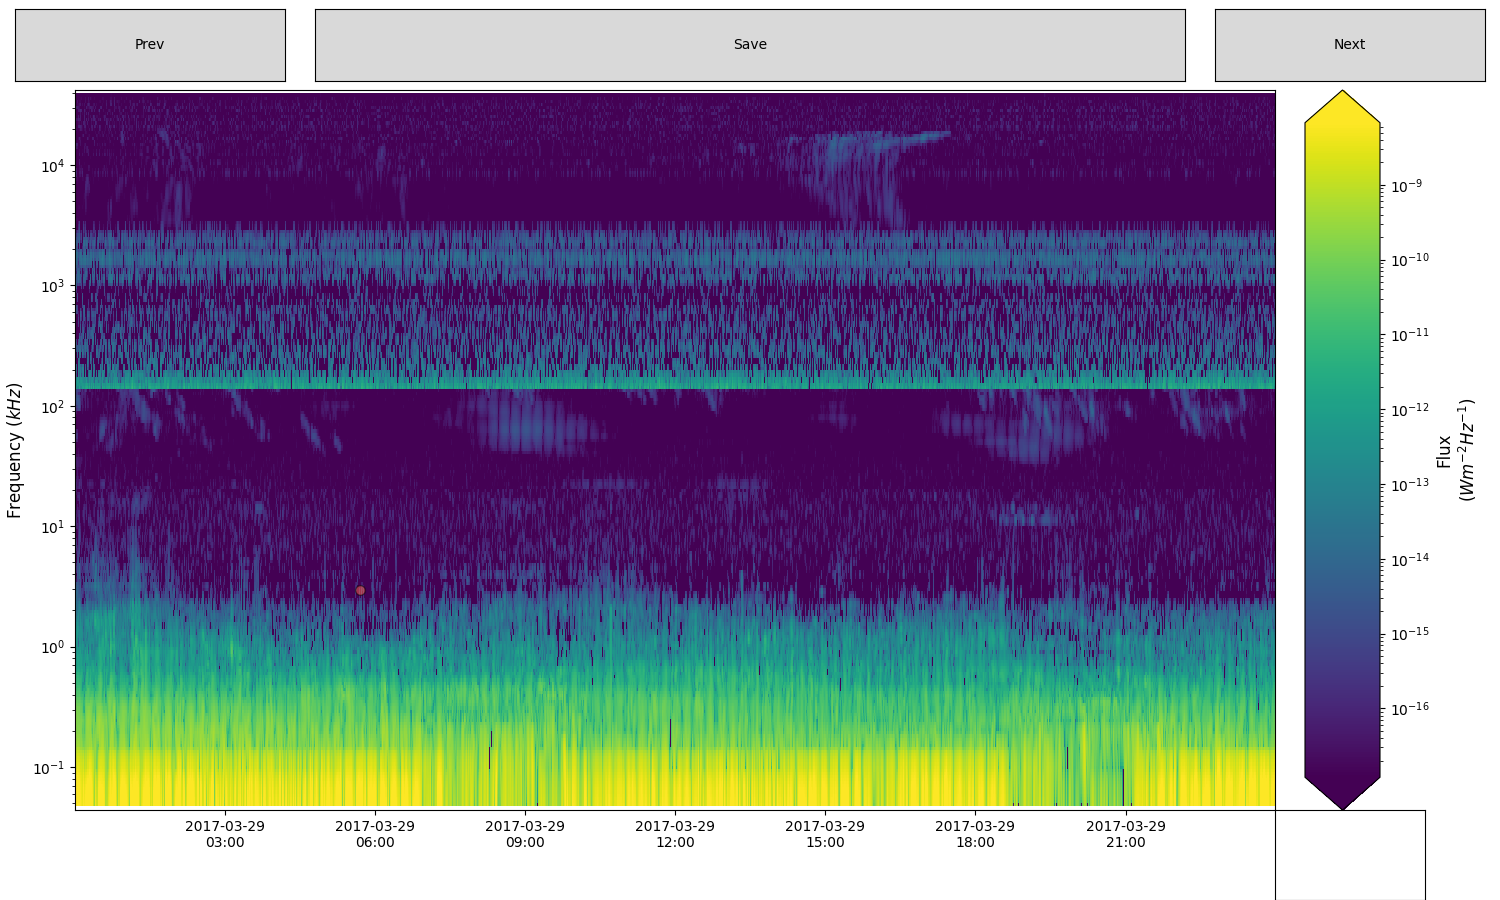
space_label.py juno_data.cdf 2017-03-29 2017-03-30
Will first load the file juno_data.cdf, processed it into hdf5 file (according to the juno.json config file), and then radio observations will be displayed for the time window 29/03/2017 to 30/03/2017:
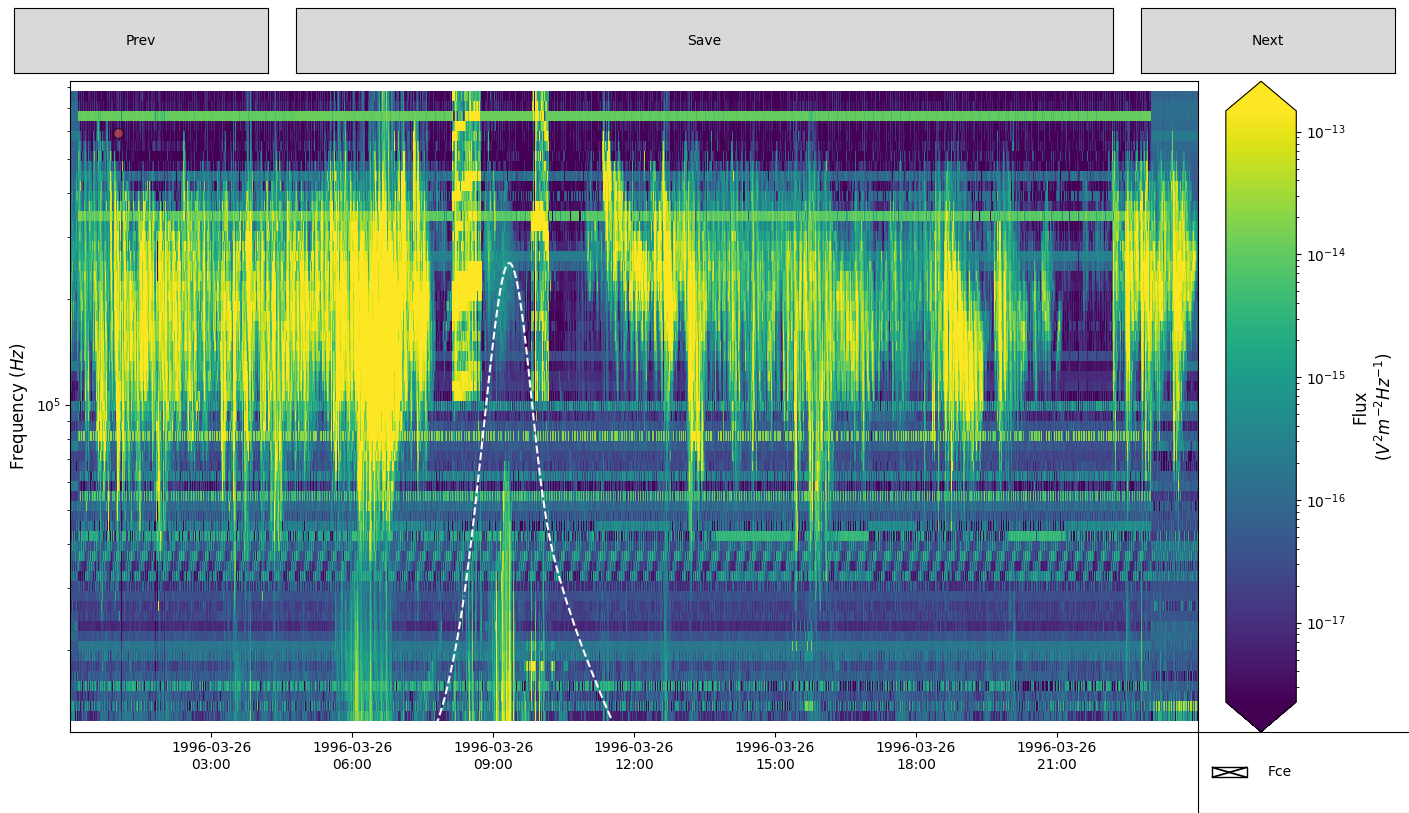
An other example of a cdf file that also contains 1D data (displayed as a white-dashed line):
space_label.py polar_data.cdf 2017-03-29 2017-03-30
Will first load the file polar_data.cdf, processed it into hdf5 file (according to the polar.json config file), and then radio observations will be displayed for the time window 26/03/1996 to 27/03/1996: